PlantPal
A smart plant pot and companion app! Powered by a linear regression model and k-nearest neighbours classifier.
Mon?
- SENSORS
- 4
- LEARNS
- NIGHTLY
- FORECAST
- 6 DAYS
- POWER
- SOLAR + USB-C
01 / Problem
Houseplants mostly die from watering mistakes
More people are growing plants in apartments with no outdoor space, and keeping them alive is the hard part. Our early secondary research showed that too much or too little water is the main reason that houseplants die, usually because people aren’t sure what the plant really needs.
02 / How it evolved
We put sensors in a pot and showed the numbers, like most plant gadgets do. However, we realized that alerts would consistently come in only after the soil had dried. Since we also noticed the impact weather has on the rate a pot dries, we hypothesized if the pot could "check" the forecast, it could proactively warn plant owners days before their plant required water.
Decisions we owned
- Giving a time range. Our first version had a vague time range (eg. “water at 2 PM”). Having a less granular time range is easier, but it can also be too general or straight up incorrect, and that erodes user trust. So to balance efficiency and usability, we decided to start PlantPal with a range (Thursday afternoon), and get more specific as the day gets closer, with a suggested best time.
- Showing similar days. When you ask why Frosty looks thirsty, PlantPal pulls up past days similar to today so observing historic patterns is easy.
- Everything runs on the pot. Both models retrain overnight right on the pot, which takes about a second. It keeps working even when Wi-Fi is down, and user data stays secure. Because small models are occasionally prone to errors, the process for fixing mistakes is super efficient (one tap!).
- Text with every face. Having a short blurb on the pot and a longer explanation on the app complements the faces nicely!
03 / The pot
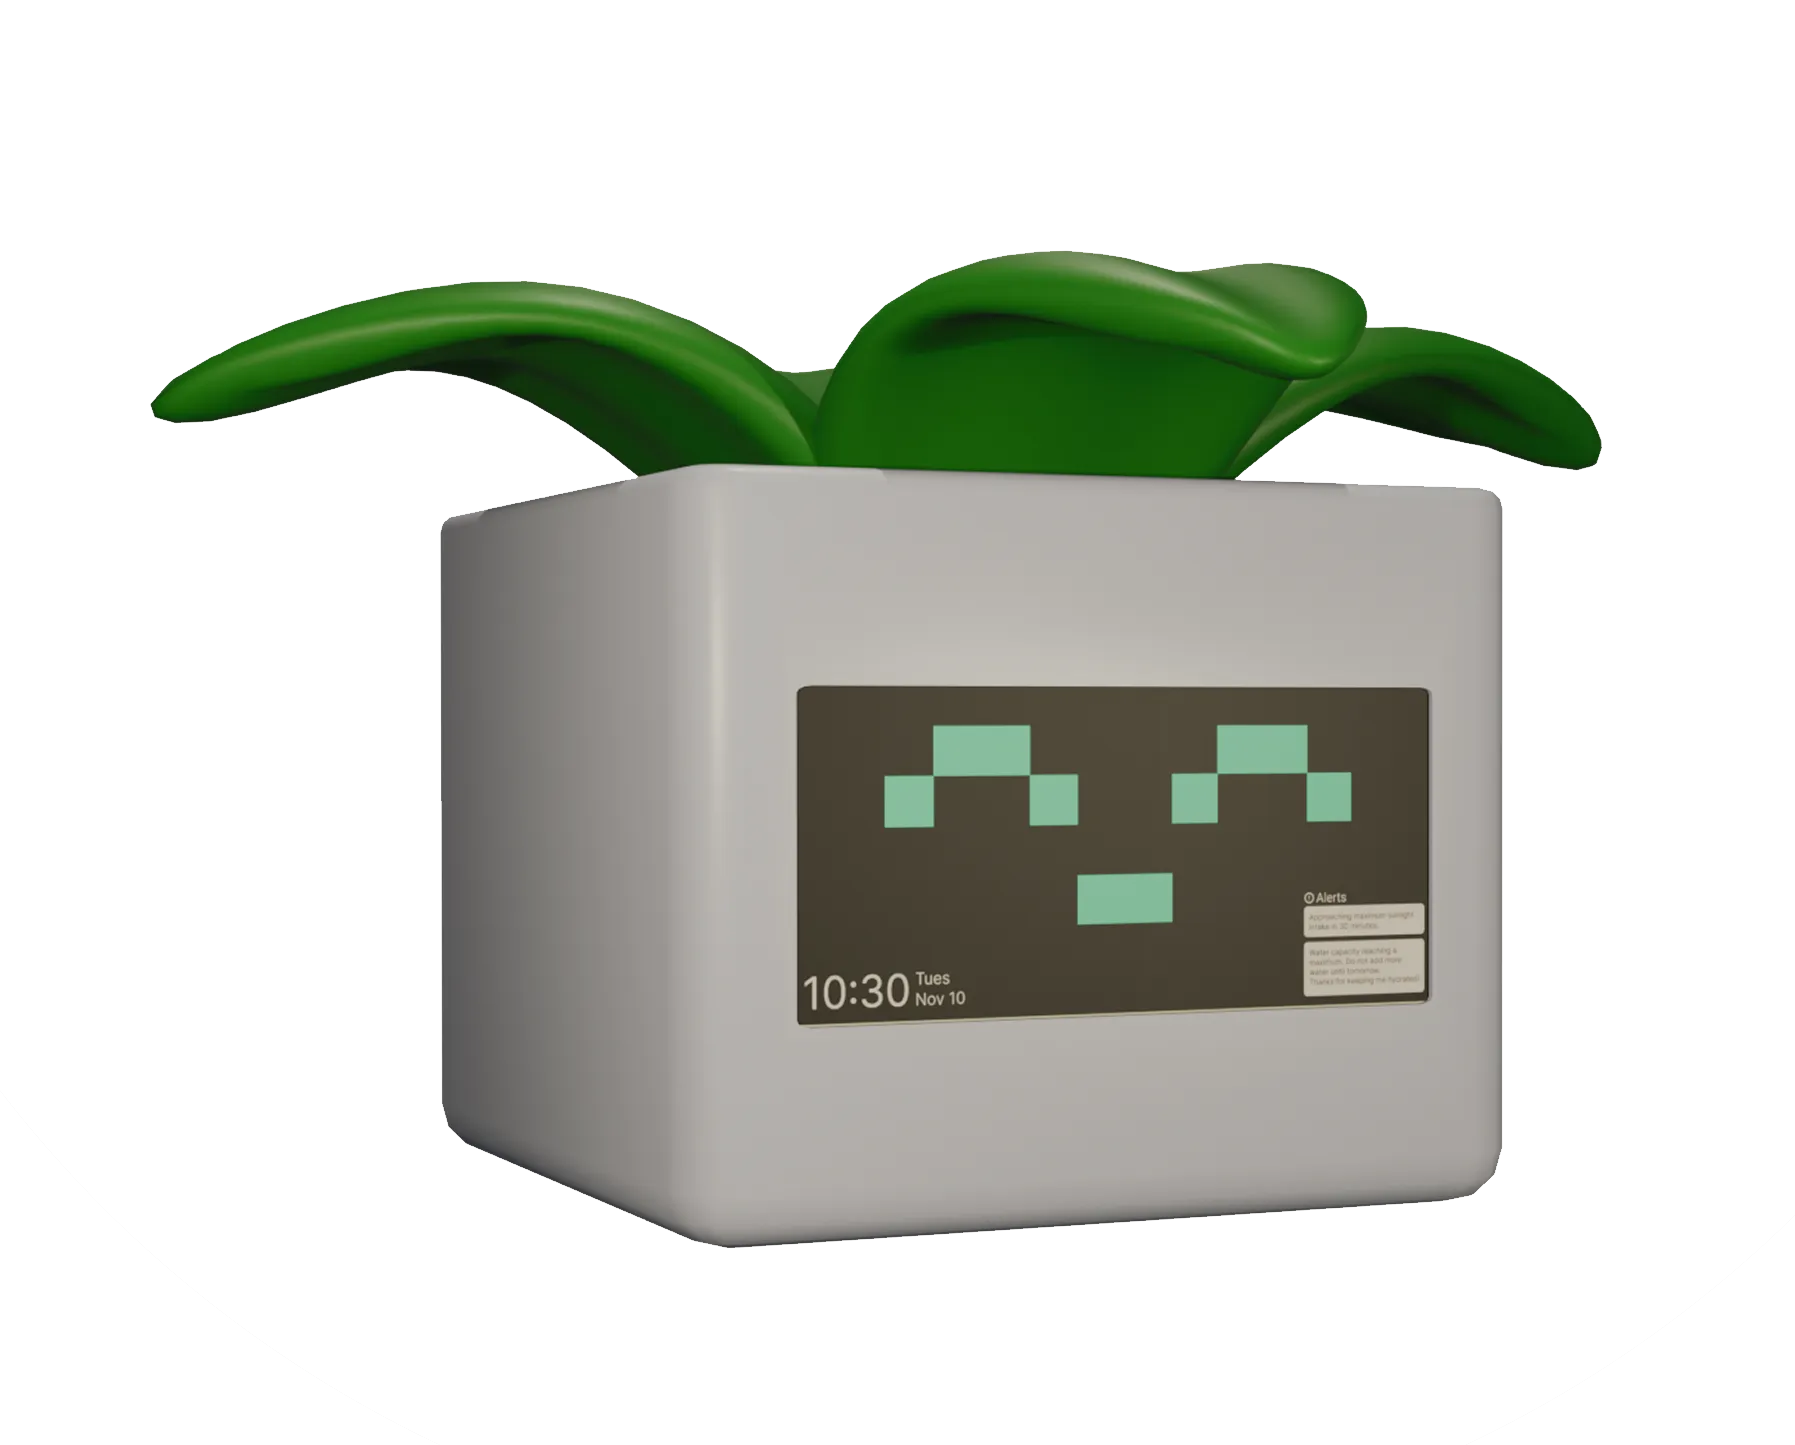
The pot is the main screen
We started by having most of the UX on the app itself, but by the end you could glance at the pot from the couch and know whether Frosty is fine.
- 01
Light and humidity sensor
SAMPLES EVERY 10 MIN
Sits on the rim, where it sees what the leaves see.
- 02
Pixel display
10 × 6 FACE + 1 LINE
Readable from across the room. Every face also has words.
- 03
Glazed ceramic shell
DRAINAGE HOLE
The window in front keeps the display flush with the glaze.
- 04
Logic board
RELEARNS OVERNIGHT IN ~1 S
Temperature sensor on board. All the learning happens here (not in the cloud!)
- 05
Moisture probe
CAPACITIVE · NO BARE METAL
Measures water in the soil without corroding.
- 06
Solar base
SOLAR + USB-C
Charges from indoor light, with USB-C for dark winters (super common in Toronto!)
-
ALL GOOD
Every similar past day looked happy
-
WATER TODAY
The soil gets too dry after 11 AM
-
BRING ME IN
It drops to 6°C at 9 PM
-
HOLD THE WATER
4 of the 5 most similar days looked soggy
The faces grew out of a screensaver in the first style guide.
04 / Where it shows up
A lot of PlantPal's features are outside of the app
A plant app is probably not one of the more exciting apps on your phone 🪴 I designed it knowing that most users rely on quick updates and notifications, and app is always there when users need more detail.
Tuesday, October 6
9:41
PlantPalnow
Bring Frosty in by 9 PM
It drops to 6°C overnight on the balcony.
PlantPal8:02 AM
Water Frosty Thursday, 11 AM–3 PM
Saturday’s rain covers the one after.
Frosty
Happy · 58%
NEXT WATER
Thu 11–3
Rain Sat, skip that one
FROSTY · THU 11–3
9:41
9:41
Happy
water Thu
Frosty
Why “happy”
Right now looks a lot like these 5 moments when Frosty was doing well.
Does Frosty look different?
Insights
Frosty dries about
3.4% a day outdoors
1.6% a day indoors · learned from 31 days
What dries it out
Blue slows drying down.
Last week · predicted vs actual
05 / The two models
The ML behind PlantPal
The watering forecast guesses how much the soil dries each hour from temperature, humidity, sunlight and wind, then runs that over the real six-day forecast. The watering window is where its range of likely outcomes dips below Frosty’s threshold.
Frosty looks happy. Every past moment most like right now looked the same.
Fetching forecast…
Next watering
…
Shaded: when the soil could dip below 40%. The band is PlantPal’s honest range.
How this prediction is made
- Every forecast hour gets four numbers: temperature, humidity, sunlight and wind. Indoors, they’re swapped for indoor conditions (about 20°C, little sun, no wind).
- It learned from 24 days of this pot’s readings how fast the soil dries in different weather, then got tested on 6 days it hadn’t seen, where it was off by about 0.020 points an hour. It’s a linear regression, which means one weight per condition, added up.
- Take away the predicted loss hour by hour and add rain back outdoors. The shaded band is how wrong it could reasonably be, mixing the model’s own misses (about ±6% over a whole day) with a forecast that gets about 4% shakier every day out.
- A real pot would retrain every night on its own readings.
Live weather from Open-Meteo. Try your own city (or move Frosty indoors)!.
The mood reader looks at the soil and temperature right now, finds the past moments most like it, and checks how Frosty looked back then. If most of them were thirsty, Frosty is probably thirsty now.
- Happy
- Thirsty
- Overwatered
- Too cold
- Too hot
Frosty looks
Happy
Every similar past moment looked like this
Nothing to do. Frosty is comfortable.
Five is the middle ground. The regions stay steady and still follow the data.
Why it thinks so: the 5 past moments most like right now
- Sep 1159% · 15°CHappy
- Sep 1065% · 19°CHappy
- Sep 3064% · 16°CHappy
- Sep 2249% · 17°CHappy
- Sep 667% · 21°CHappy
Click the map or drag the sliders. Arrow keys work on the map too.
More detail: how the models work and how we checked them
The watering forecast is a linear regression: each condition gets a weight and the weights are added up, and least squares picks the weights that miss past readings by the least. We kept it fairly simple because drying mostly adds up, and the weights are readable enough to power the app’s “What dries it out” card.
We trained it on the first 24 days and tested on the last 6 then compared it with always guessing the average. Untick a condition below to see how much worse it gets.
Split by time, not at random, so the model is graded on days it has never seen. That’s how it will be used.
What it pays attention to · untick one to retrain without it
Longer bars matter more. Orange speeds drying up and blue slows it down. (These are the model’s weights, with every feature put on the same scale first.)
Its guesses vs what happened · test days
The mood reader is k-nearest neighbours (k-NN). “Neighbours” are the most similar past moments and k is how many it asks. With only about 140 tagged moments, a neural net would memorize noise and couldn’t say why it decided anything, while k-NN’s reason is a list you can check. Both inputs get put on the same 0–1 scale first, or moisture would drown out temperature.
System map
From sensor readings to a line on the pot
More detail: learning over time
Feedback
Four everyday signals
- Day one
- A new pot starts from species defaults (Frosty: water every 2–3 days, 15–20°C) and calls its advice an estimate for about a week.
- No internet
- It projects from the sensor trend alone and labels the window an offline estimate.
- Sudden jump
- A reading far off the prediction isn’t learned automatically. User confirmation is required (eg. an answer to “Did you just water Frosty?)”
- You disagree
- If you tap Droopy, the face changes right away and your tag counts "extra".
06 / First prototypes
Where the pot came from

Open the first Figma prototype
More detail: heuristics and palette
- Recognition > Recall
- Visual cues and to-do lists, so nobody has to remember when they last watered.
- Error prevention
- Alerts before the plant declines.
- Visibility of system status
- Live readings make the plant’s state clear at a glance.
- Flexibility and efficiency
- Even when you're out, you can monitor the pot's status.
#6D7340#A0A677#5B6237#ECE7D5